
Airlines and Transportation
We leverage more than a decade of experience in delivering innovative omni-channel solutions for passengers of top global transportation businesses.
Since 2003, Pointwest has delivered quality and innovative IT and BPM services and solutions to various industries. Since the dawn of the Industry 4.0, we enable businesses from various markets to effectively transform and leap forward with innovative and efficient solutions for their operations and their customers.
We leverage more than a decade of experience in delivering innovative omni-channel solutions for passengers of top global transportation businesses.

We empower businesses in the retail industry to converse, engage, and sell products to their consumers using the latest smart digital solutions and platforms.

We deliver innovative and quality solutions for Banking and Financial institutions to deliver financial services to their market and improve the state of global financial inclusion.

We combine our domain expertise and innovation to provide solutions for one of the most Industry 4.0 disrupted industries — Supply Chain.

Serve the people better by making public service more efficient, accurate, timely, accessible, and secure with the use of the latest digital technologies and techniques.
HEALTHCAREHealthcare Solutions & ServicesIT Solutions & ServicesHealthcare Products OUR OFFERINGS Custom solutions and services based on your needs. With our expertise in providing digitally enabled healthcare BPO services, we can help your organization experience business transformationthrough technology to help you simplify the task of serving your customers better. CLINICAL TRIALS We push healthcare forward by […]
The rush to adapt to the Next Normal was one of the biggest challenges that confronted the business world as early as the initial outbreak of the Covid19 global pandemic. The Black Swan ushered a new age of innovation as it forced companies to pivot how to get their work done. Skriba, the smart […]
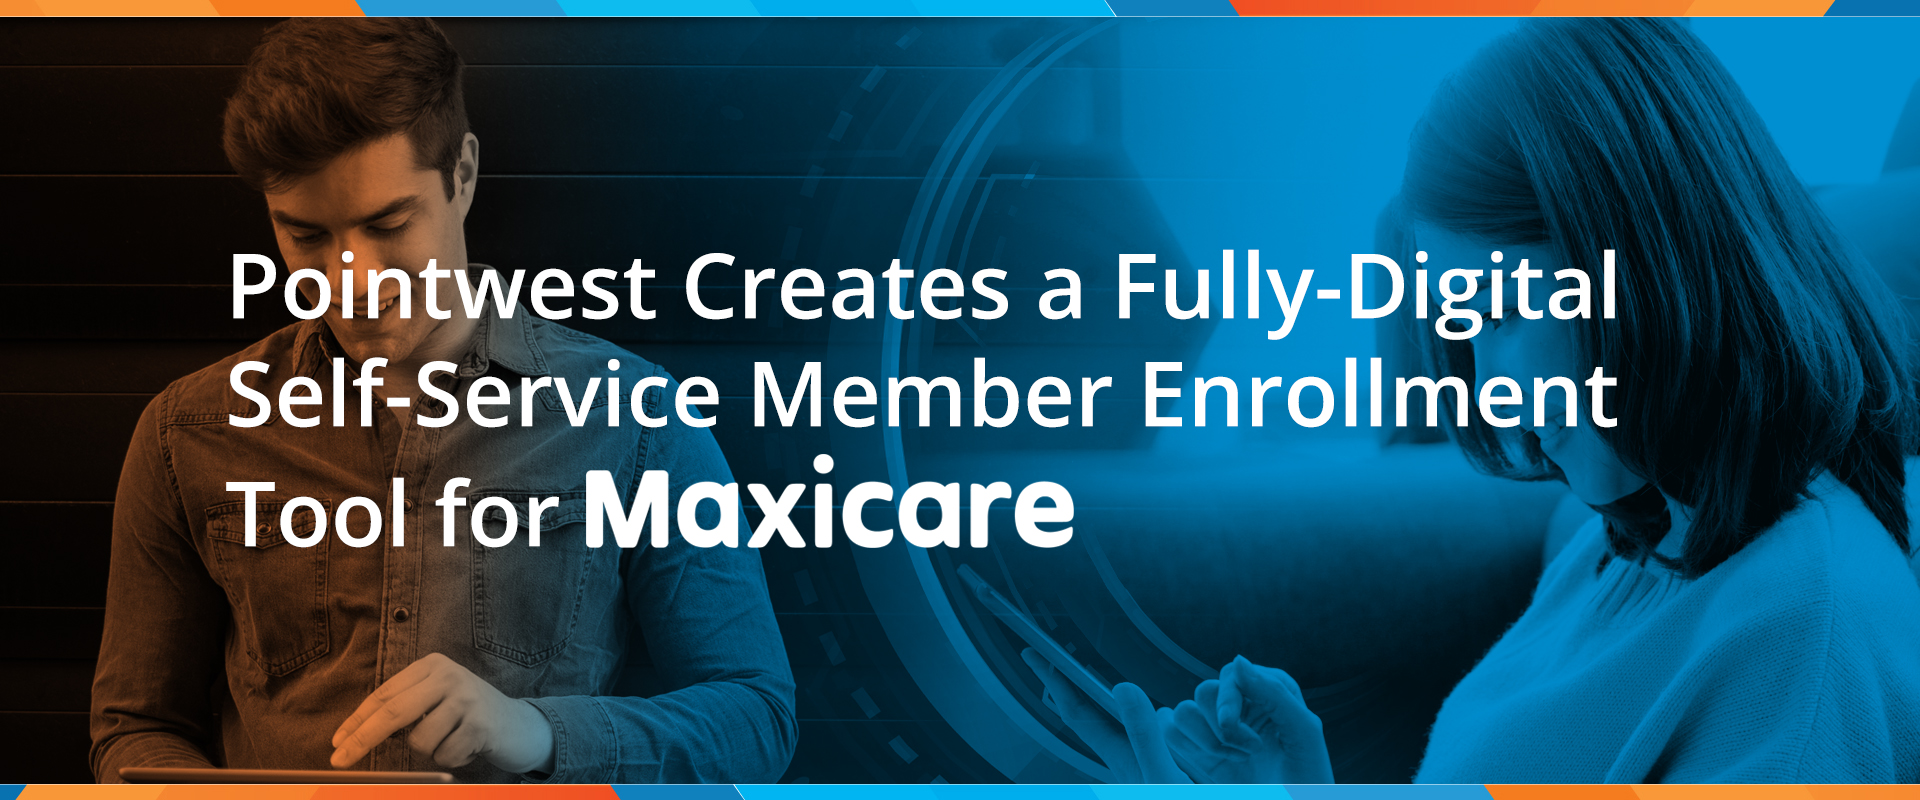
Read how Pointwest helped modernize Maxicare’s online services with a fully digital, self-enrollment system.
